Your analytics say people visit a page and leave without doing the thing you built it for. They do not say what those people did while they were there. So what is a heatmap, and how does it fill that gap? A heatmap paints a picture of the page itself, colored by where visitors tapped, how far they scrolled and where they lingered, so you can see what a page is really used for.
This guide explains what a heatmap is, the four kinds you will meet in tools such as Microsoft Clarity, how to read each one without fooling yourself, and how to turn what you see into a change worth making. The worked example is real: the heatmaps of a restaurant menu page on Happy Menu, a website whose owner lets us publish its data, from September and October 2026.
In short
- A website heatmap shows what many visitors did on one page, added together and drawn over a picture of the page: warm colors for more, cool colors for less.
- There are four common kinds: click or tap maps, scroll maps, attention maps and area maps. Each answers a different question.
- Read a heatmap with its filters, its sample size and its screenshot in mind. A map of the wrong device, too few visits or an old version of the page tells you the wrong story.
- A heatmap shows what happened, never why. Pair it with recordings, analytics and a careful look at the page before you change anything.
- The best heatmap findings are specific: one important link nobody taps, one block of plain text people keep tapping, one drop in the scroll map just above your offer.
What is a heatmap?
A heatmap is a picture of a web page colored by how visitors used it. Areas that received many clicks, taps, scrolls or seconds of attention are warm, usually red and orange, and areas that received few are cool, usually blue, or left uncolored.
Microsoft’s documentation for Clarity, a free heatmap tool, describes a heatmap as a tool for analyzing “aggregated information about how users interact with the website.” The key word is aggregated. A single visit tells you almost nothing; a heatmap adds hundreds or thousands of visits together so that patterns stand out. Where one session recording shows you one person, a heatmap shows you the crowd.
The word also has a second meaning you may meet in search results. In data visualization, a heat map is any grid or table where color shows the size of each value, such as a calendar colored by sales per day or a matrix of correlations. The idea is the same, color standing in for numbers, but this guide is about website heatmaps: the ones drawn over your pages to show what visitors did.
What is a heatmap used for on a website? Mostly to answer questions your analytics cannot:
- Do people see the offer, the price or the form, or do most leave before they reach it?
- Which links and buttons do people actually use, and which important ones do they ignore?
- Do people tap things that are not links, such as headings, photos or icons, expecting something to happen?
- Which parts of a long page hold attention, and which do people skim straight past?
- Did a change you shipped move behavior, compared with the weeks before it?
The four types of website heatmap
Click or tap heatmaps show where people clicked, scroll heatmaps show how far down the page they got, attention heatmaps show where they spent time, and area heatmaps add up the clicks inside a part of the page you choose.
- Most used links and buttons
- Taps on things that are not links
- Share of visits that reach each depth
- Where the biggest drop happens
- Time spent on each band of the page
- Sections people skim past
- All clicks inside a chosen area
- Compare a menu, a form or a banner
Click and tap heatmaps
A click heatmap marks every click on a computer, or every tap on a phone, as a spot of color, and ranks the elements that received the most. Microsoft notes that a click heatmap also helps you find “parts of the design user mistake for links.” That is often its most useful job. Good tools add filtered views on top: dead clicks, where Clarity saw no response to a click; rage clicks, where someone clicked again and again in the same small area; and first and last clicks, which show how people start and end a visit to the page.
Scroll heatmaps
A scroll heatmap colors the page from top to bottom by the share of page views that reached each depth: warm at the top, where everyone was, and cooler further down as people leave. Alongside the colors you get the numbers, such as 80% of page views reaching a quarter of the way down, and a line for the average fold, which Microsoft describes as “the average location visible on a webpage before the user starts scrolling.” Everything above that line, most visitors saw without doing anything.
Attention heatmaps
An attention heatmap colors each band of the page by how long visitors kept it on screen. A section people stop to read glows; a section they scroll past stays cool. It is the closest thing to eye tracking most teams will have, but it measures what was on screen, not what people looked at, so treat it as a strong hint rather than proof of reading.
Area heatmaps
An area heatmap lets you draw a box around part of the page, such as the navigation, a pricing table or a form, and shows the total clicks inside it. It is useful when clicks spread over many small elements, such as a menu with twenty links, and you want to know whether the whole thing is earning its space.
A real heatmap example: the phone number nobody tapped
On a busy restaurant menu page, the tap heatmap showed more than half of all taps going to the category bar, and one tap on the cafe’s phone number in four weeks, although calling was the only way to order pickup.
Happy Menu hosts menus for restaurants. One of the busiest is Al Nar Cafe’s menu in New York, a long page of dishes with photos and prices, with the cafe’s pickup details at the end: “Takeaway Available,” the address and a phone number. During an audit of a diner’s journey, checking whether they can order a dish for pickup and see its cost before committing, UX Robot read the page’s Clarity heatmaps for phones from 22 September to 19 October 2026, with Singapore excluded as the website’s evidence settings ask.
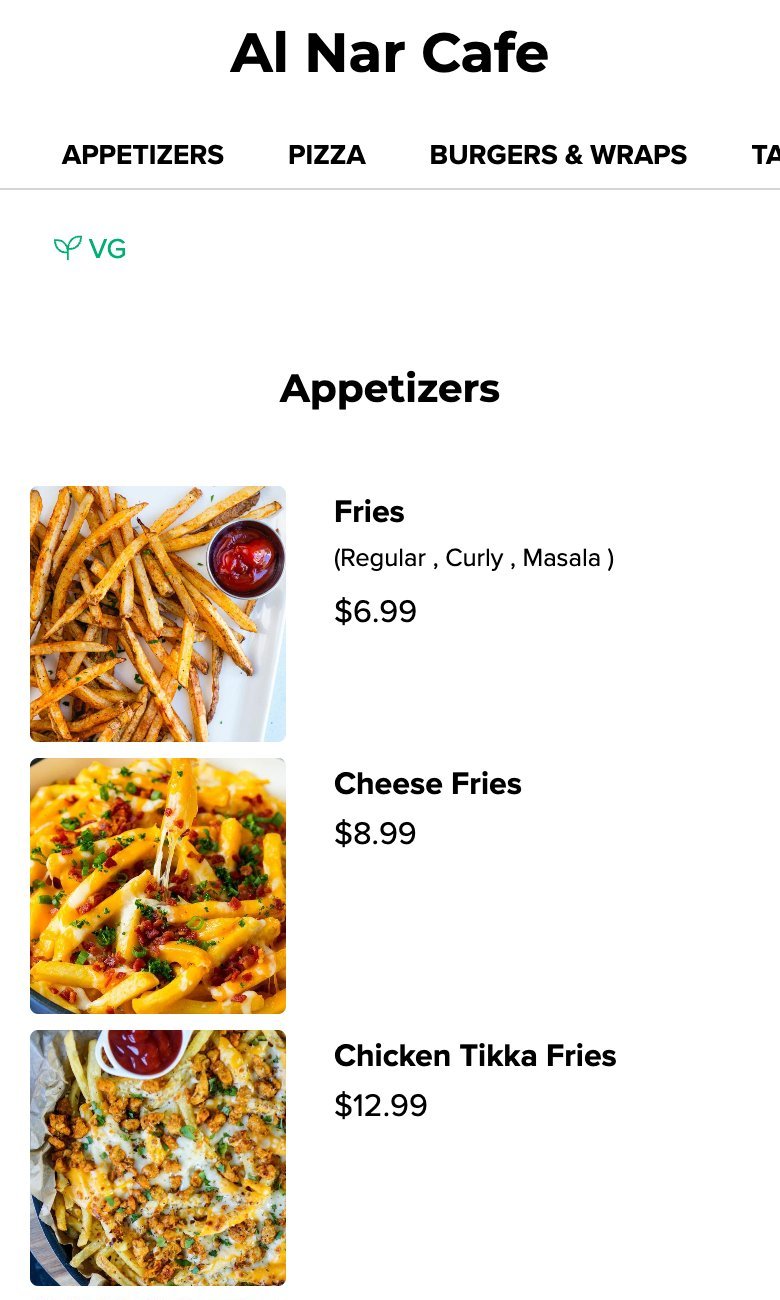
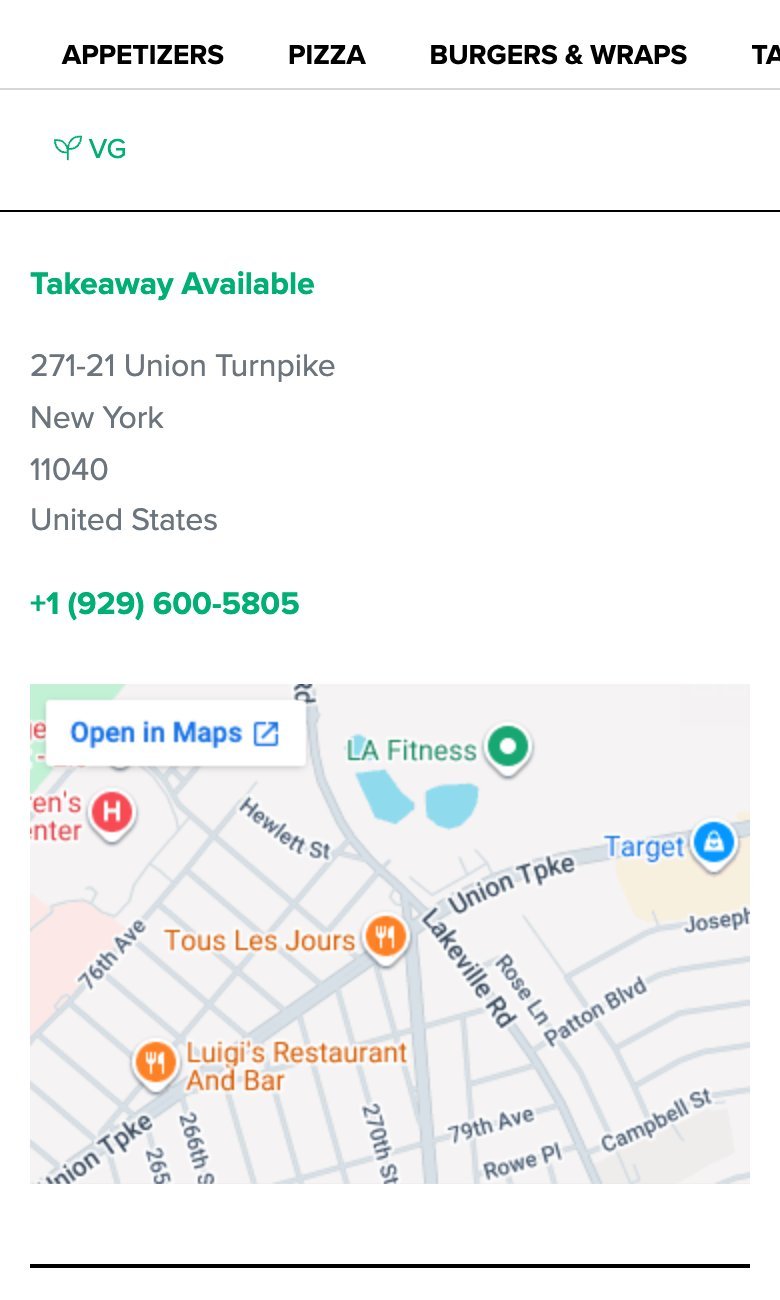
The screenshots show the page as it was on 7 November 2026. Clarity’s own heatmap images stay inside Clarity, so we show the figures instead. Here is the tap ranking:
What the three maps said together. The tap map showed people working the category bar hard: the nine busiest categories in it took 1,161 of the 2,047 taps between them. The scroll map showed that about three in four page views scrolled as far as the pickup details, so the problem was not that people never reached them. The attention map showed that people spent less than 1% of their time on that part of the page; they scrolled past it. Put together, the story is clear. Visitors browse the menu with interest, decide what they want, and then the one thing they need to order it, the phone number, sits at the end of the page among the address details, where nobody is looking.
What changed because of it. The audit turned the pattern into a specific fix: repeat the existing phone link below the cafe’s name and below dish prices, labeled “Call for pickup,” and keep the full details at the end. It also said how to measure it: count taps on the phone link per page view, with a separate event for each placement, and compare before and after. That is the shape of a good heatmap finding. It names an element, gives the evidence, proposes a change you can test and says which number should move.
Notice what the heatmap alone could not tell us. It could not say whether people wanted to call, or whether they went to a delivery app instead. Those are questions for recordings, for analytics and, ideally, for a few customers. The heatmap told us where to look.
How to read a website heatmap, step by step
Check the filters and the sample first, confirm the screenshot matches the live page, then read the scroll map, the click map and the attention map in that order, and write down each pattern as a question to test.
- Choose one page and one devicePhones and computers behave differently. Never read them mixed together.
- Check the dates and the sampleKnow how many page views the map is built on, and over which weeks.
- Compare the screenshot with the live pageIf the page changed, the colors may sit on the wrong content.
- Read the scroll map firstFind the biggest drop and what sits just below it.
- Then the click or tap mapLook for ignored calls to action and taps on things that do nothing.
- Then the attention mapSee which sections hold people and which they skim past.
- Write each pattern as a questionThen check it in recordings and analytics before you change the page.
1. Choose one page and one device
A phone and a computer show different layouts, so a tap at a given spot on a phone and a click at the same spot on a computer can land on completely different things. Most tools let you switch device. Read phones first if most of your visitors use them, which for many websites they do. In Clarity, confirm the device filter appears as a chip above the map; a filter that did not apply is invisible in the numbers.
2. Check the dates and the sample
Heatmaps are only as good as the number of visits behind them. Clarity will draw a map from any amount of traffic, and its documentation says there is “no minimum traffic limitation” to generate one. That is convenient, and it means the judgment is yours. With a few dozen page views, one curious visitor can create a hot spot. Thousands of page views, like the menu above, give you patterns you can trust. Note too that Clarity builds each map from up to 100,000 page views, and keeps heatmaps for up to nine months, so long date ranges on busy pages are a sample, not everything.
Also ask who is in the sample. Your own team’s visits, test sign-ups and automated traffic all count unless you filter them out. On Happy Menu’s home page, Clarity had already excluded 101 computer sessions it identified as bots in four weeks, and the remaining sessions still included the team’s own test visits.
3. Compare the screenshot with the live page
A heatmap is drawn on a stored picture of the page. If you redesigned the page during the period, or since, the colors can sit on content that no longer exists. Clarity’s FAQ is clear that it “doesn’t support uploading or recapturing screenshots to match a heat map,” so the fix is to narrow the dates to after your change. This is not a rare problem. More on that in the mistakes section.
4. Read the scroll map first
The scroll map tells you what everyone else is reacting to. Find the steepest drop, the depth where the share of page views falls fastest, and look at what sits just above and below it. If your price, your main button or your sign-up form sits below the point where half of visitors have gone, no amount of polish on that section will matter until people reach it.
5. Then the click or tap map
Look for three things. Calls to action that get far fewer clicks than you expected. Plain text, headings, photos or icons that get clicks they cannot answer, which means people think they are links. And heavy use of a control you thought was minor, such as the category bar on the menu above, which tells you what people actually came to do.
6. Then the attention map
The attention map tells you whether people who reached a section stopped for it. A section with high scroll reach and almost no attention, like the pickup details above, is being seen and dismissed. That is usually a sign it does not look important, or does not look like what it is.
7. Write each pattern as a question
“Nobody taps the phone number” is an observation. “Do people who decide to order look for a way to call, and fail to find it?” is a question you can check in recordings and test with a change. Writing patterns as questions keeps you honest about what the heatmap showed and what you are guessing.
How to read a scroll heatmap
Read a scroll heatmap as a curve: the share of page views that reached each depth. Look for the steepest drop, check what sits just above it, and make sure your most important content and action sit above the point where most visitors have left.
Here is a real scroll curve, from Happy Menu’s home page on computers, 182 page views between 23 September and 20 October 2026:
The shape is common. Between 20% and 40% of the way down, three in ten page views stop. After that the curve is almost flat: nearly everyone who passes 40% reads to the end. Two groups, then. One leaves after the first screen or two, and one is genuinely interested and reads everything. The useful question is what the first group needed and did not see. That is where to spend your effort, not on the bottom of the page, which the interested group reaches anyway.
How much should you worry about content far down the page? Eye-tracking research from Nielsen Norman Group, with 120 participants and over 130,000 eye fixations, found that people spent 57% of their page-viewing time above the fold and 74% in the first two screenfuls, as reported in its 2018 article Scrolling and Attention. People do scroll, but attention thins as they go. Your scroll map shows you exactly how much it thins on your page.
One caution about menu pages, galleries and anything with jump links. On the Al Nar Cafe menu, 89% of page views reached 80% of the way down, which looks like remarkable reading. It is partly the category bar: tapping a category jumps the page down, so scroll depth there measures jumping as much as reading. Always ask how people moved before you praise or blame a scroll map.
How to read a click heatmap
Read a click heatmap by its ranking, not just its colors. Check whether your main call to action is near the top, which elements get clicks they cannot answer, and whether dead clicks or rage clicks cluster anywhere.
Colors on a click map draw the eye to busy areas, but the ranked list of elements beside the map is where the decisions are. On Happy Menu’s QR code menus page on phones, 25 taps over four weeks in September and October 2026 split like this: the two demo buttons took 8 taps, 32%, while 7 taps, 28%, landed on text, headings and images that are not controls, including a sentence about using the same menu for dine in and pickup. That is a small sample, 55 page views, so it is a lead rather than a verdict. But it points at a well-known problem: people need to be able to tell what they can tap. Nielsen Norman Group’s guidance on making clickable elements recognizable says users need to know which areas are “plain static content, and which areas are clickable (or tappable).”
Then look at the problem clicks. In Clarity, a dead click is one where, in Microsoft’s words, “the visual status doesn’t change, and there’s no navigation away from the page.” A rage click is a burst of clicks in one small area in quick succession. Both can mean a broken or slow control, or something that only looks like a control. On the Al Nar Cafe menu, the audit also found category taps that went unanswered, which became its own fix: mark the chosen category at once and move to it before doing anything else.
Finally, see what takes clicks away from your goal. On Happy Menu’s home page on computers, 11 of 40 clicks over four weeks, 27.5%, went to the chat widget’s launcher, its text and its close icon. A chat button that gets a quarter of the clicks may be doing a good job, or it may be covering something, or opening by accident. Recordings tell you which.
Common heatmap mistakes, and how to avoid them
Most heatmap mistakes come from reading the wrong data: mixed devices, too few visits, an outdated screenshot, bots and your own team’s visits, or a heatmap read as an explanation rather than a clue.
Before you read the map
- The map covers one device type, confirmed by a filter chip.
- It covers enough page views for the pattern you are reading, ideally hundreds.
- The dates start after the last change to the page.
- The stored screenshot matches the page people see today.
- Bots, your own team and test traffic are excluded, or noted.
- Traffic from countries or campaigns that do not represent your customers is filtered out.
While you read it
- You read the ranked list of elements, not just the colors.
- You compare reach, clicks and attention for the same section.
- You note what sits just below the steepest drop in the scroll map.
- You treat clicks on plain text, photos and icons as a design question.
- You treat dead and rage clicks as possible bugs to check in recordings.
- You write each pattern as a question, with the number that would answer it.
The outdated screenshot is the most common trap. On Happy Menu’s home page, the heatmap’s stored screenshot was an earlier version of the page, headed “Your Customers. Your Direct Orders.” and 3,287 pixels tall. The live page had a new headline, new button labels and was 8,461 pixels tall. Clicks on the new buttons could not be told apart in the ranking, and every scroll percentage referred to the old layout. The map still had value, for the share of visitors who left early, but none of its colors could be matched to today’s sections.
Attention maps can move between loads. When UX Robot loaded the Al Nar Cafe attention map three times, the band with the most time changed between loads. Only the pattern that appeared every time, very little time on the pickup details, was reported. If a reading would change your decision, load it again.
A heatmap is not a reason. It is tempting to read a cold call to action as “people do not want this.” It may just be below the fold, low in contrast, worded unclearly, or slow to respond. The heatmap tells you where people did and did not go; the page, the recordings and your analytics tell you why.
Heatmaps, recordings and analytics: which to use when
Use analytics to find the pages that matter and the step where people leave, heatmaps to see what people did on those pages, and recordings to watch a handful of individual visits that explain the pattern.
- Analytics, such as Google Analytics 4, count visits, sources and goals across the whole website. GA4 records a scroll event only “when a 90% vertical depth becomes visible,” according to Google’s list of automatically collected events, so it tells you who reached the end, not where the rest stopped.
- Heatmaps show, page by page, where people clicked, how far they scrolled and where they spent time. They answer “what happened on this page?”
- Session recordings replay single visits. Watch them in groups, such as visits from ads that left without clicking, so that one unusual person does not decide your redesign.
- Usability testing with real people, even five of them, tells you what they expected and why. It is the only one of the four that hears people think.
Heatmaps also need care with privacy. Clarity masks sensitive content by default, and Microsoft notes that content typed into input boxes “is masked in all modes.” Check your own tool’s settings, mention it in your privacy policy, and respect your visitors’ consent choices.
Reading heatmaps well takes time: setting filters, checking screenshots, comparing maps and following patterns into recordings. That is part of what UX Robot’s page audits take on. Your own AI agent opens the page like a visitor, checks it against every WCAG 2.2 level A and AA criterion, UX Robot’s usability checks and its search checks, and, if you use Microsoft Clarity, reads the page’s click, scroll and attention heatmaps and errors in your own Clarity, then writes up every problem with a screenshot, the fix and its severity. The free plan includes five page audits a month and Pro makes them unlimited. Enterprise audits whole journeys with your GA4, Search Console and Clarity data, reads recordings in groups, sends issues to your tracker and rechecks them after you ship. See the plans, or start with the steps in our guide to UX audits.
Heatmap questions people ask
What is a heatmap used for?
On a website, a heatmap is used to see what visitors do on a page: what they click or tap, how far they scroll and which parts hold their attention. Teams use it to find ignored calls to action, content people never reach and things people mistake for links, and to check whether a change moved behavior.
What do the colors on a heatmap mean?
Warm colors, red, orange and yellow, mark areas with more activity: more clicks, more visitors reaching that depth or more time on screen. Cool colors, green and blue, mark less, and uncolored areas had little or none. The colors are relative to the page, so always read the numbers beside them too.
Which heatmap tool is best?
The best one is the one you will actually read. Microsoft Clarity is free; its FAQ says it is “a free service forever” with no traffic limits. Paid tools add features such as surveys and funnels. Whichever you choose, the reading method in this guide is the same.
How many visits does a heatmap need?
There is no fixed number, and tools will draw a map from very little traffic. As a rough guide, treat a map built on a few dozen page views as a lead to check, and one built on hundreds or thousands as a pattern. The more a decision costs, the more data you want behind it.
How do you create a heatmap for a website?
Install a heatmap tool such as Microsoft Clarity by adding its tracking code to your website, or through a plugin or tag manager. It starts collecting data straight away, and Clarity says clicks appear on heatmaps within 30 minutes. Give busy pages a week or two, and quieter ones longer, before you draw conclusions.
Are heatmaps allowed under privacy laws?
They can be, when the tool masks personal data, your privacy policy describes it and you respect consent where the law requires it. Clarity masks sensitive content by default and builds heatmaps from the attributes of page elements rather than their content. Check the rules that apply to your visitors.
Sources
- Heatmaps overview, Microsoft Clarity documentation, updated December 2025.
- Click maps and Scroll maps, Microsoft Clarity documentation, updated October 2026.
- Attention maps, Microsoft Clarity documentation, updated October 2025.
- Semantic metrics, Microsoft Clarity documentation, updated December 2025: dead clicks, rage clicks and quick backs.
- Masking content, Microsoft Clarity documentation, updated December 2025.
- Frequently asked questions, Microsoft Clarity documentation, updated October 2026.
- Scrolling and Attention, Nielsen Norman Group, 2018.
- Beyond Blue Links: Making Clickable Elements Recognizable, Nielsen Norman Group, 2015.
- Automatically collected events, Google Analytics Help.
- Microsoft Clarity heatmaps of happymenu.co read during UX Robot audits: the Al Nar Cafe menu page on phones, 22 September to 19 October 2026; the QR code menus page on phones, 11 September to 8 October 2026; and the home page on computers, 23 September to 20 October 2026. Published with the owner’s permission.